
Trade Guide
The Future of Freight: AI, IoT & Blockchain in International Shipping
The future of freight is becoming more predictive, connected, and digital. This blog explains how AI improves decision-making, IoT expands r...
India’s imports from China, Vietnam, Indonesia, and Thailand reveal very different sourcing patterns and risk profiles. This blog breaks down key trade numbers and explains what they mean for category dependence, supply continuity, and sourcing strategy. It helps importers read trade data as a practical planning tool rather than just a statistics update.
For Indian importers, Asia is not one sourcing block. The numbers show very different kinds of dependence.
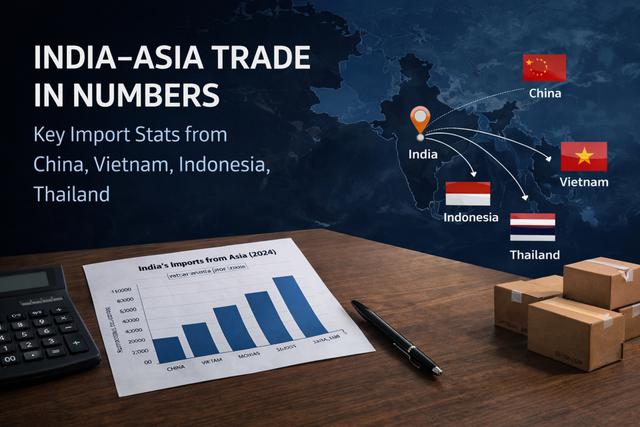
India’s merchandise imports in FY2024-25 were $720.24 billion. China alone accounted for 15.74% of that import basket, and the Government told Rajya Sabha that imports from China reached ₹9,59,665.71 crore in FY2024-25. By comparison, the Ministry of External Affairs’ India–ASEAN brief shows that in 2024-25 India imported $22.78 billion from Indonesia, $14.27 billion from Thailand, and $10.33 billion from Vietnam. ASEAN as a whole supplied $84.16 billion of imports to India in that year.
Those numbers matter because each country plays a different role in India’s import mix. China still dominates several critical manufacturing-linked categories, while Vietnam, Indonesia, and Thailand matter more selectively depending on the product group.
An importer may buy from only one market today, but country concentration still shapes cost, continuity, and fallback options.
Government data says most goods imported from China are capital goods, intermediate goods, and raw materials such as APIs, auto components, electronic parts and assemblies, and mobile-phone parts that feed fast-growing sectors like electronics, pharma, telecom, and power. That means country-level trade numbers are not only about customs statistics. They are also a map of supply-chain concentration risk.
China is still the largest single-country supplier in the comparison set by a wide margin.
The Government’s December 2025 reply in Rajya Sabha says China’s share in India’s total imports was 15.74% in FY2024-25. In several categories, dependence was materially higher: electronics components at 37.94%, telecom instruments at 43.41%, computer hardware and peripherals at 49.46%, industrial machinery at 45.30%, and bulk drugs and drug intermediates at 74.11%. A February 2026 Lok Sabha reply separately described major imports from China as electronics components, telecom instruments, computer hardware and peripherals, industrial machinery, organic chemicals, and electric machinery and equipment.
This is why China remains the key benchmark in any India-Asia sourcing conversation. It is not just big in value; it is deeply embedded in critical input categories.
Among Vietnam, Indonesia, and Thailand, Indonesia is India’s biggest import source by value.
The India–ASEAN brief puts India’s FY2024-25 imports from Indonesia at $22.78 billion. DGCI&S country-note search results describe Indonesia as accounting for about 3.21% of India’s total imports in FY2024-25 and identify coal, coke and briquettes, vegetable oils, and iron and steel among the leading import groups. Coal, coke and briquettes alone accounted for 36.90% of India’s imports from Indonesia in FY2024-25.
That makes Indonesia particularly relevant for importers exposed to energy, industrial raw materials, and bulk upstream inputs.
Thailand sits in the middle of the comparison set.
India imported $14.27 billion from Thailand in FY2024-25, according to the India–ASEAN brief. DGCI&S country-note search results say Thailand accounted for 2.02% of India’s total import value in FY2024-25 and was India’s 17th largest import partner. Those same trade notes list other precious and base metals, organic chemicals, and plastic raw materials among the top Indian imports from Thailand.
That means Thailand often matters less as a headline-value story and more as a specialized industrial-materials source.
Vietnam is the smallest of the three ASEAN comparators here by value, but strategically it is more important than that single number suggests.
The Embassy of India in Hanoi says India imported $10.33 billion from Vietnam in FY2024-25, up 10.59% year on year. The embassy also lists electronic equipment, telecom equipment, machinery and mechanical appliances, iron and steel, ordinary metals, chemicals, plastics, footwear, garments, textiles, wood, rubber, and coffee among major Indian imports from Vietnam. DGCI&S trade-note search results add that telecom instruments, computer hardware and peripherals, and consumer electronics are leading import groups from Vietnam, and that telecom instruments accounted for 14.87% of India’s imports from Vietnam in FY2024-25.
For importers, that makes Vietnam especially relevant in electronics-adjacent and assembly-linked sourcing conversations.
The main lesson is that value and vulnerability are not the same thing.
China still matters most where India depends on components, intermediate inputs, and pharma-linked materials. Indonesia matters more for resource-heavy and commodity-linked imports. Thailand matters more in industrial-material categories. Vietnam matters increasingly in electronics, telecom, and assembly-linked supply chains. So the right sourcing question is not only “Which country is bigger?” It is “Which country matters most for my SKU mix?”
These trade patterns matter most for importers whose margins or production continuity depend on one narrow country basket.
That includes electronics importers dependent on China or Vietnam, industrial buyers reliant on Indonesian raw materials, chemicals and plastics buyers exposed to Thailand, and pharma-linked buyers exposed to China’s bulk-drug ecosystem. The country mix is different, but the planning discipline is the same: map dependency before a cost spike or supply break forces you to.
Use this before your next sourcing review:
Map your top import SKUs by source country.
Separate value dependence from category dependence.
Check where China is still the hard-to-replace source.
Identify where Vietnam can be a second-source option in electronics.
Review whether Indonesia exposure is commodity-led or processing-led.
Check Thailand-linked material inputs for cost volatility.
Recalculate landed cost by country, not only by supplier quote.
Review whether trade agreements change duty outcomes.
Build a shortlist of alternate suppliers before disruption hits.
Align freight planning with country-level sourcing concentration.
These are the common importer mistakes when reading country trade data:
comparing only total import value and ignoring category dependence
assuming a smaller country matters less strategically
treating China, Vietnam, Indonesia, and Thailand as interchangeable sourcing bases
ignoring the raw-material versus component difference
using trade totals without translating them into SKU-level exposure
This is where execution data becomes as useful as trade data.
Cogoport’s official pages say businesses can access instant freight quotes, rates and schedules, customs-linked services, multi-shipment tracking, Cogo Assured, and Pay Later. For importers comparing country options, that helps translate country-level sourcing strategy into live routing, freight, and landed-cost decisions more quickly.
India’s import numbers across China, Vietnam, Indonesia, and Thailand tell a clear story: China remains dominant where industrial and critical-input dependence is high, while Vietnam, Indonesia, and Thailand each matter more in specific baskets than in overall scale. That is why importers should read country numbers as supply-chain risk data, not just trade statistics. The companies that understand which country matters to which SKU will usually make better sourcing and freight decisions than the ones who only look at total import value.
Press Information Bureau, India’s trade release for FY 2024-25, 16 Apr 2025. Used for India’s merchandise import total of $720.24 billion.
Government of India, Rajya Sabha, “Imports from China,” answered 05 Dec 2025. Used for China’s FY2024-25 import value in ₹ crore and its 15.74% share in India’s total imports.
Government of India, Rajya Sabha, same reply on “Imports from China.” Used for China’s category dependence in electronics components, telecom instruments, computer hardware, industrial machinery, and bulk drugs in FY2024-25.
Government of India, Lok Sabha, “Dependency on Chinese Products,” answered 19 Aug 2025. Used for the description of Chinese imports as raw materials, intermediate goods, and capital goods for Indian industry.
Government of India, Lok Sabha, question on India-China trade and import structure, answered 10 Feb 2026. Used for major principal commodities imported from China.
Government of India, Rajya Sabha, “Rising imports from China and strategic trade imbalance,” answered 13 Mar 2026. Used for the Government’s diversification stance and recent import declines in selected China-linked sectors.
Ministry of External Affairs, “Brief on India-ASEAN Relations,” 15 Jul 2025. Used for FY2024-25 import values from Indonesia, Thailand, Vietnam, and ASEAN as a whole.
Embassy of India, Hanoi, “Trade & Economic Relations.” Used for India’s FY2024-25 imports from Vietnam, their growth rate, and major import categories.
DGCI&S / country-trade note search results on Vietnam. Used for telecom instruments, computer hardware and peripherals, consumer electronics, and the 14.87% telecom-instruments share.
DGCI&S / country-trade note search results on Indonesia. Used for Indonesia’s import share in India and the dominance of coal, coke, and briquettes.
DGCI&S / country-trade note search results on Thailand. Used for Thailand’s import share in India and its leading import categories.
Ministry of Commerce, India-ASEAN trade agreements pages. Used for context on India’s formal trade architecture with ASEAN.
Cogoport, official platform, rates, tracking, Cogo Assured, and Pay Later pages. Used for current product references in the Cogoport section.
The future of freight is becoming more predictive, connected, and digital. This blog explains how AI improves decision-making, IoT expands r...

Growing import businesses often lose time and money through manual freight coordination. This blog uses published SME examples to show how d...

Learn how online freight marketplaces help importers get instant container-shipping quotes, compare options quickly, and improve booking dec...